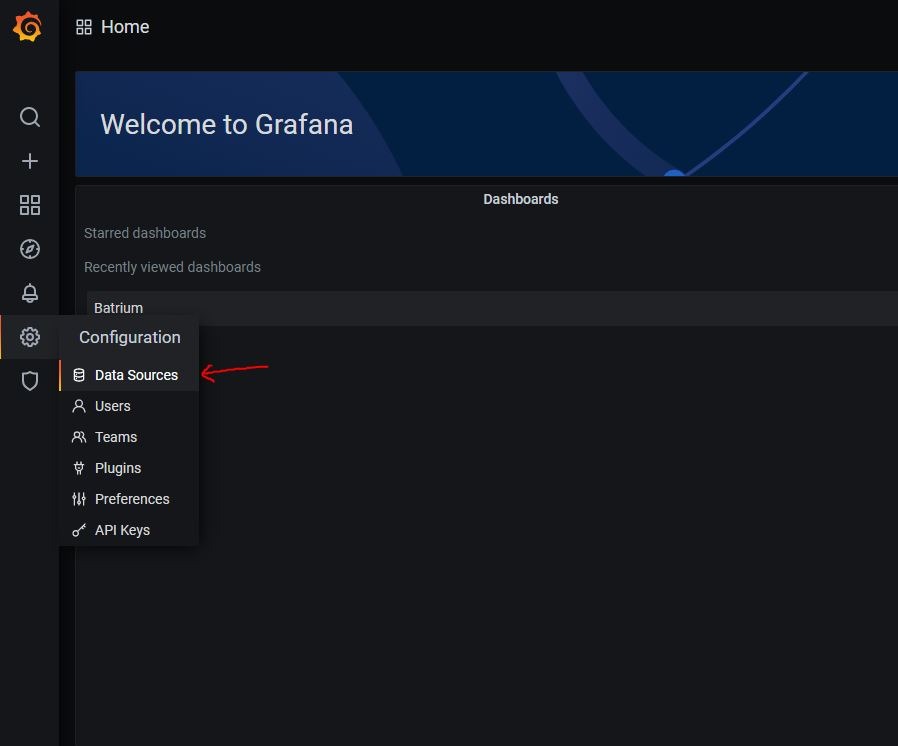
Nearly there, let’s set up Grafana!
Go to Grafana in your PC browser, using the Pi4’s IP address suffixed with “:3000”, for example:
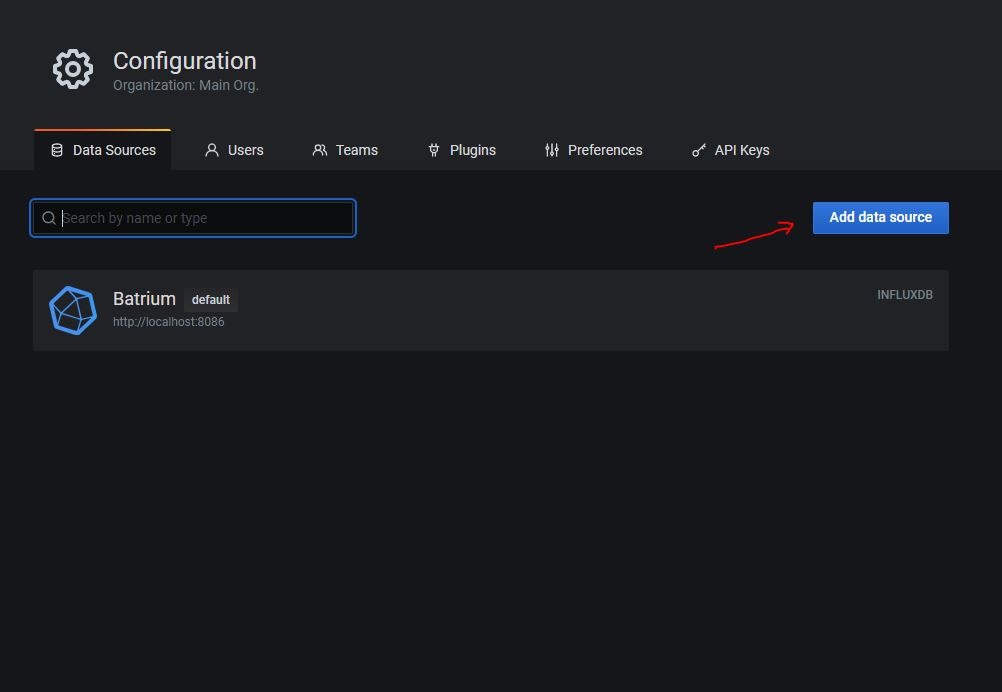
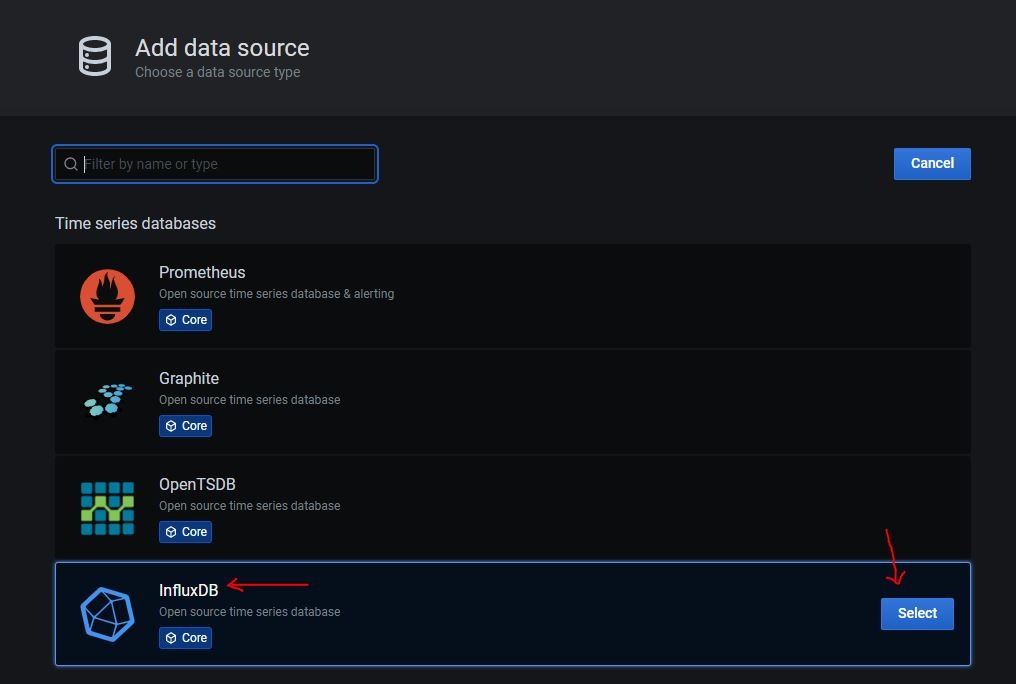
http://<Pi4ipaddress>:3000We now need to set up Grafana. In a nutshell, we need to do two things. First, add the influxdb data source. Secondly, import the Dashboard.
Skipped too far ahead?
Part 1 : Hardware configuration
Part 2 : Installing software
Part 3 : Configuring Grafana
Part 4 : Credits and final thoughts
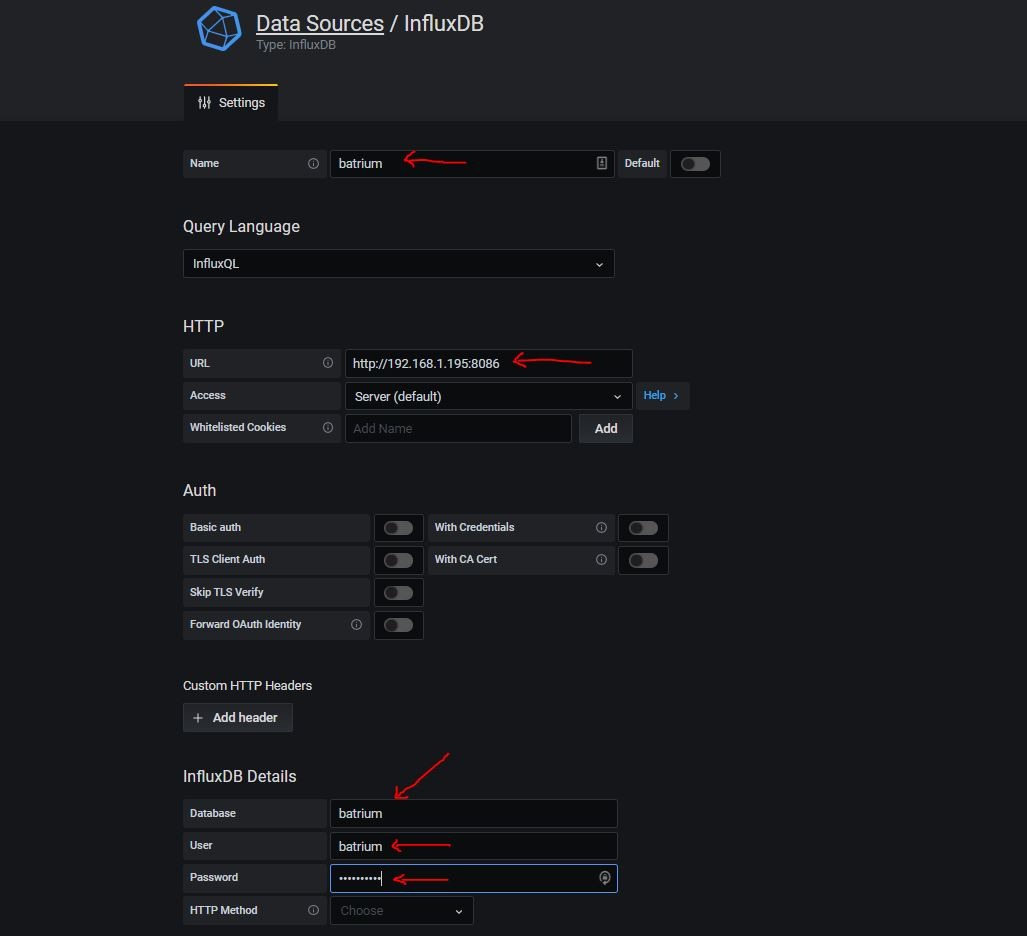
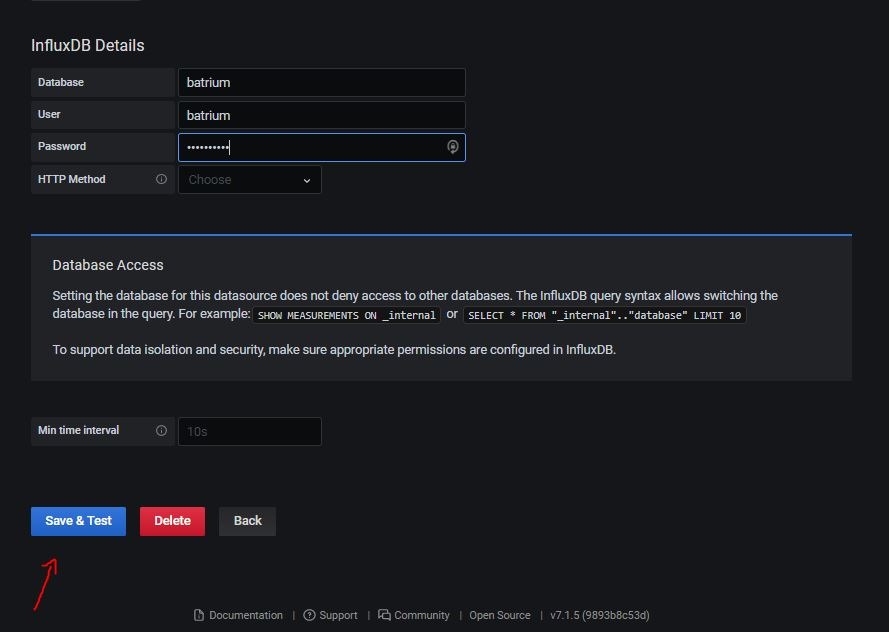
User: batrium
Pass: 123456
Doing the same for Mate3? Simply create another database connection and put “mate” in the database field.

Now to install the dashboard


And tharrr she blows!

2 replies on “Batrium + Mate3 + Grafana : Part 3”
I can’t find the json for the grafana dashboard 😦
LikeLike
My apologies – I’ve fixed the link, and the JSON can be found here – https://wordpress.com/post/lazootin.com/258 🙂
(No guarantees that it works in 2022!)
LikeLike