Get data from your Mate3 data into your InfluxDB database.
This guide assumes that you have already set up a RPi4 with InfluxDB + “batrium” user, node-red, grafana, etc. and know how to use the Pi’s CLI.
Head into your Pi4 CLI, we need to create another Influx database for the Mate3 data we’re about to grab.
influx

#type 'influx' you will notice a different CLI prompt. This is normal, you are now in the influx CLI.

create database mate

grant all on mate to batrium

show databases

show users

exit

influx -username 'batrium' -password '123456' -database mate

exit
Congratulations, you now have an empty Mate3 database for all of your tasty data!
Importing the Mate3 flow into node-red
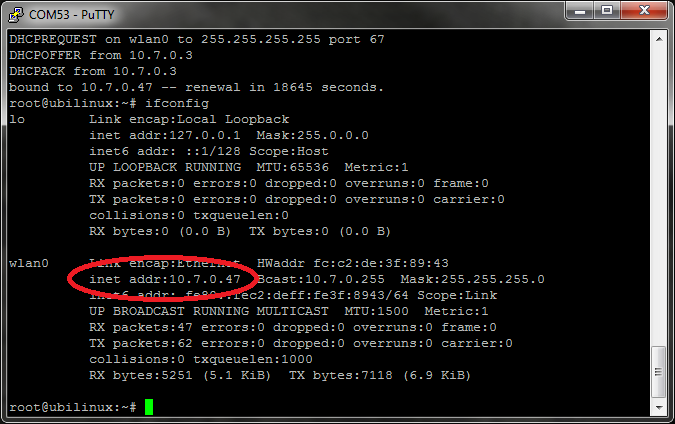
Open Node-Red in your PC web browser.
IP address of your Pi4 into your URL bar, suffixed with :1880- ie, 10.7.0.47:1880
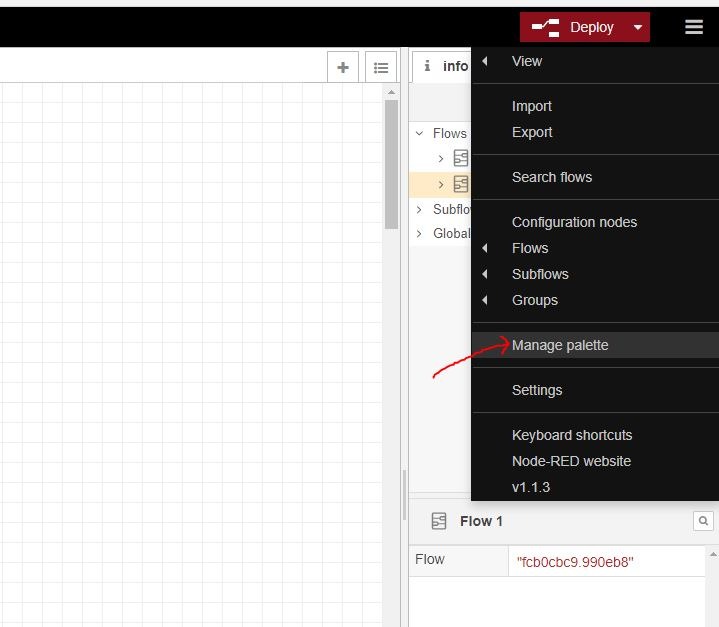
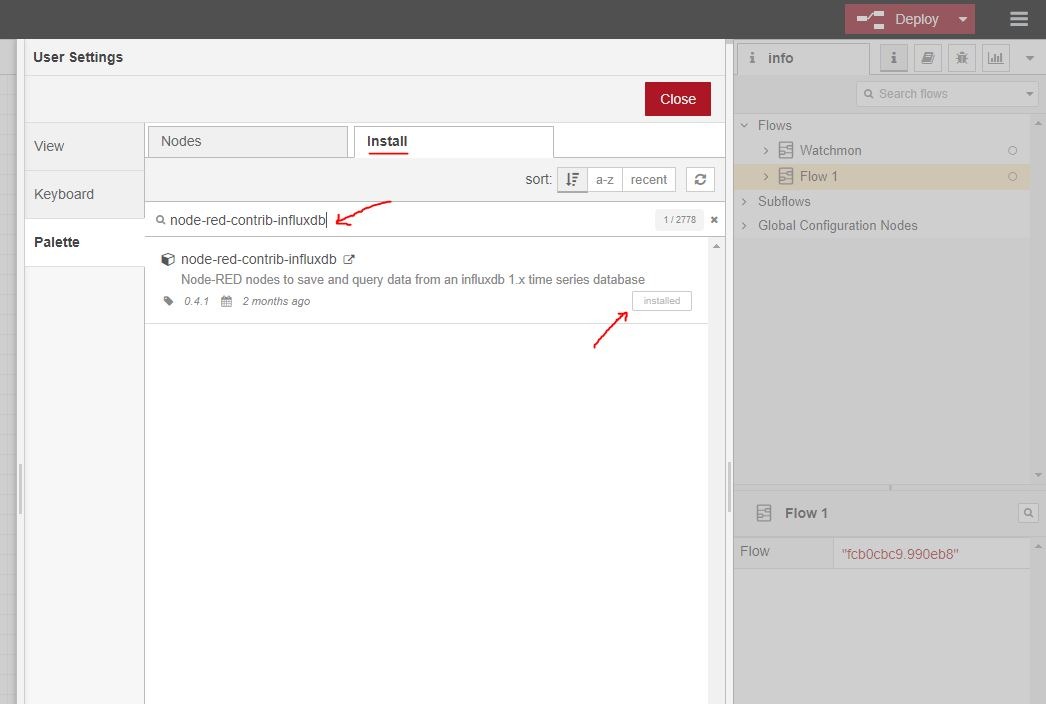
In the top-right menu icon, click on Manage palette.
Click HERE to download the Mate3 flow JSON
Import the Mate3 flow json by clicking the top right menu icon, then click on import.
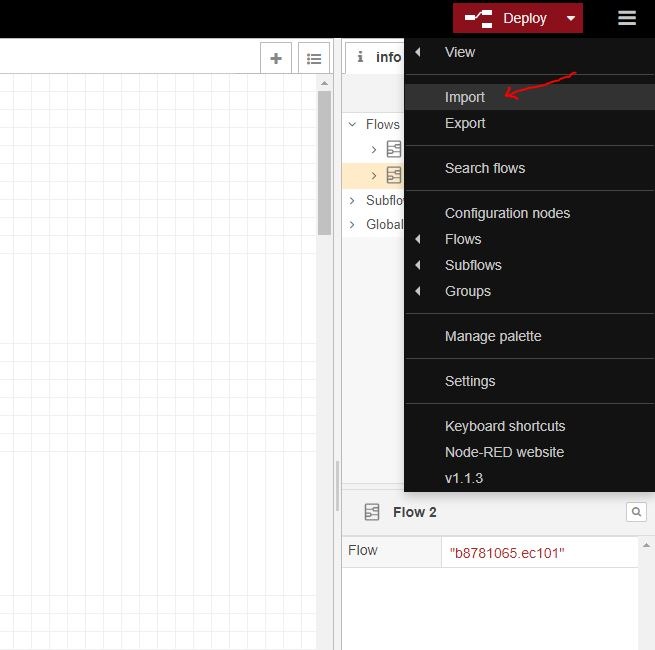
Past in the Mate3 JSON file, import to “new flow”, and click “import”

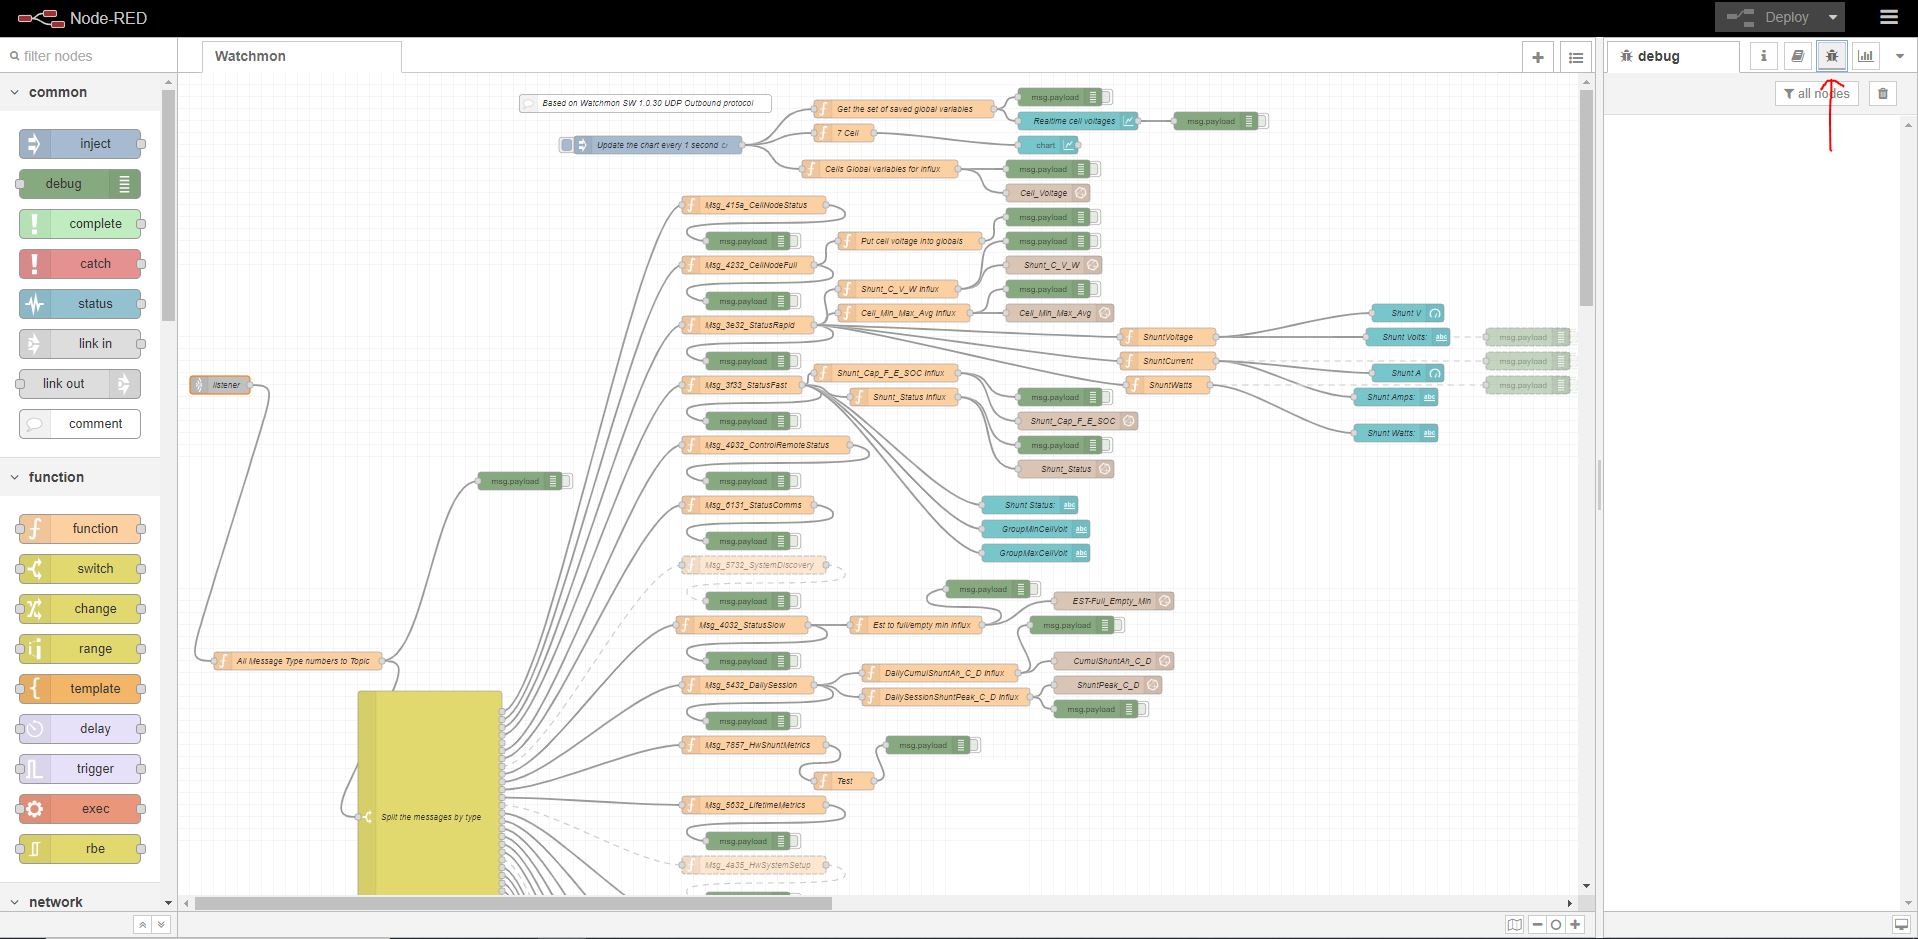
Your page should look something like this.

How this flow works, and what you need to change.
From left to right;
- Blue inject node “5 sec” tells the flow to run every five seconds.
- Yellow http request node “Mate3” “GET”s data from your Mate3 JSON, and returns a parsed JSON object
- Orange function nodes grab individual lines of data from the Mate3 JSON
- Grey influxdb out nodes send those individual lines of data from node-red into your “mate” Influxdb database.
So the first step we need to fix is to tell the http request node where your JSON file with all of the Mate3 data is – ie, what the IP address of your Mate3 address is.
For what it’s worth, here is Outback Solar’s documentation for programming the Mate3.
For most people, there is no easy way to find this address. I personally use a Unifi network, so I can easily check the IP address of the Mate3 device (called AlphaTec) in my Unifi app.
You could perhaps log into your router and check a list of connected devices, find “AlphaTec“, and copy the IP address down.
Alternatively, you could use a piece of free-trial software called “Solarwinds IP Address Manager”.
However you do it, you NEED to get this IP address – in my case, it’s 10.0.0.66
Our Mate3 IP address is 10.0.0.66
Using Chrome, install JSON Viewer, or any other extension that auto-formats JSON files.
Take this IP address, append /Dev_status.cgi?Port=0 to the end of it, and paste it (http://<mateIPaddress>/Dev_status.cgi?Port=0%20A) into your web browser to confirm that it’s the correct address.
If all goes to plan, you’ll be greeted by something like this:

Therefore, our Mate3 JSON file is located at
http://<mateIPaddress>/Dev_status.cgi?Port=0%20A
If it didn’t work, then you may want to double check to ensure you got the correct IP address. If you’re SURE that it’s the correct IP address, then perhaps you have a firewall blocking traffic across your network and I can’t help you – may as well give up now.
Assuming it DID work, it’s VERY important that you remove the “&” in front of “Port=0”, if it’s present when using the address URL from here on in.
For whatever reason, it’s an error introduced to the URL that Chrome can remove automatically, but it’ll stop the URL from working once inside node-red.
Take the address of your Mate3’s JSON (in our case, it’s http://10.1.1.66/Dev_status.cgi?Port=0%20A) and enter it in the Mate3 node settings page, as per below.
Ensure that;
- Method = GET
- Payload = Ignore
- Return = a parsed JSON object
- Name = Mate3

Congrats! If everything went to plan, then your node-red flow is ingesting data from your Mate3!
And now is the hard part…
Telling node-red to grab the right JSON data.
Everyone’s setup is different, so here is where you need to get “coding”.
Below is the JSON data from my Mate3.
{
  "devstatus": {
    "Gateway_Type": "Mate3s",
    "Sys_Time": 1610996763,
    "Sys_Batt_V": 25.8,
    "ports": [
      {
        "Port": 1,
        "Dev": "FX",
        "Type": "230V",
        "Inv_I": 4,
        "Chg_I": 0,
        "Buy_I": 0,
        "Sell_I": 0,
        "VAC_in": 0,
        "VAC_out": 232,
        "Batt_V": 25.8,
        "AC_mode": "NO AC",
        "INV_mode": "Inverting",
        "Warn": [
          "Temp Sensor Fail"
        ],
        "Error": [
          "none"
        ],
        "AUX": "disabled"
      },
      {
        "Port": 2,
        "Dev": "FX",
        "Type": "230V",
        "Inv_I": 0,
        "Chg_I": 0,
        "Buy_I": 0,
        "Sell_I": 0,
        "VAC_in": 0,
        "VAC_out": 224,
        "Batt_V": 26.0,
        "AC_mode": "NO AC",
        "INV_mode": "Off",
        "Warn": [
          "Temp Sensor Fail"
        ],
        "Error": [
          "none"
        ],
        "AUX": "disabled"
      },
      {
        "Port": 3,
        "Dev": "FX",
        "Type": "230V",
        "Inv_I": 0,
        "Chg_I": 0,
        "Buy_I": 0,
        "Sell_I": 0,
        "VAC_in": 0,
        "VAC_out": 226,
        "Batt_V": 26.0,
        "AC_mode": "NO AC",
        "INV_mode": "Off",
        "Warn": [
          "Temp Sensor Fail",
          "Fan Failure"
        ],
        "Error": [
          "none"
        ],
        "AUX": "disabled"
      },
      {
        "Port": 9,
        "Dev": "CC",
        "Type": "FM60/80",
        "Out_I": 4.2,
        "In_I": 1,
        "Batt_V": 25.9,
        "In_V": 73.0,
        "Out_kWh": 8.7,
        "Out_AH": 330,
        "CC_mode": "Bulk  ",
        "Error": [
          "none"
        ],
        "Aux_mode": "Manual",
        "AUX": "disabled"
      },
      {
        "Port": 10,
        "Dev": "CC",
        "Type": "MX60",
        "Out_I": 2.0,
        "In_I": 0,
        "Batt_V": 25.9,
        "In_V": 68.8,
        "Out_kWh": 6.0,
        "CC_mode": "Bulk  ",
        "Error": [
          "none"
        ],
        "Aux_mode": "Disabled",
        "AUX": "disabled"
      }
    ]
  }
}
You can see that ports 1,2,3 are VFX3524 inverters, while my two charge controllers are on ports 9 and 10.
If we look at the “Function” tab of the orange Inv1 kW function node – which tells me how many kW my inverter is currently using – in node-red (pictured below), you’ll see some… code. Frankly, I don’t know what kind of code it is… heck, I can’t even remember how I wrote it – all I know is that it works. (but I’ll try to explain, anyway).
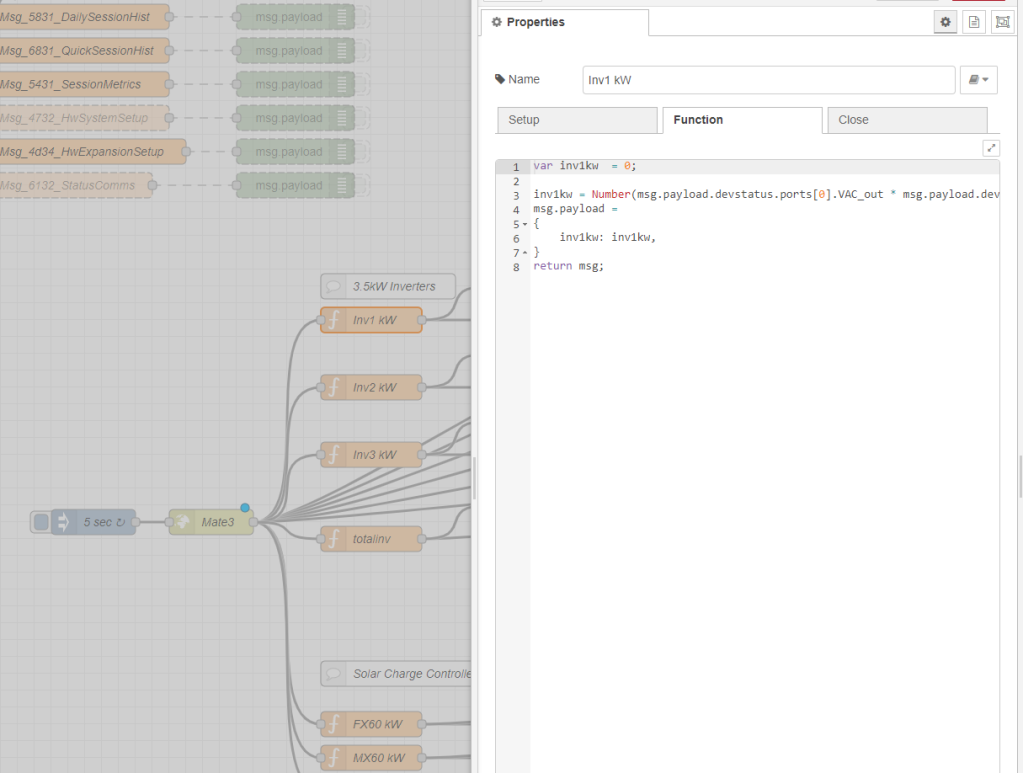
var inv1kw  = 0;

inv1kw = Number(msg.payload.devstatus.ports[0].VAC_out * msg.payload.devstatus.ports[0].Inv_I);
msg.payload =
{
    inv1kw: inv1kw,
}
return msg;
First we have to create/specify a variable which we want node-red to send to our influxDB “mate” database, let’s call it “inv1kw“, and assign it a starting value of 0.
Now that node-red understands that inv1kw is a variable that exists, we want it to calculate a value for it.
We tell it to assign inv1kw the value resulting from multiplying the VAC_out (volts) by the Inv_I (amps), which results in the wattage out.
Then there is some other code, I don’t really know what it does but it works, so #yolo. If you’re copying this code to use on other variables you want to report on, just make sure that you change the “inv1kw” name to something else relevant – ie, if you wanted to know what amps are being output by your MX60 solar charge controller, you might call that variable “mxamps“.
Understanding how to point to data in your JSON.
Below is a stripped-down example of the JSON from my Mate3 inverter – I’ve removed all valued except from “Port” and “Batt_V”, and will illustrate how to refer to each of these Batt_V values in your node-red flow.
If you can’t figure out how to write code to refer to other values after this explanation, then I recommend you go find some resources on the internet regarding “JSON dot notation”.
{
  "devstatus": {
    "Gateway_Type": "Mate3s",
    "Sys_Time": 1610996763,
    "Sys_Batt_V": 25.8,
    "ports": [
      {
        "Port": 1,
        "Batt_V": 25.8,
      },
      {
        "Port": 2,
        "Batt_V": 26.0,
      },
      {
        "Port": 3,
        "Batt_V": 26.0,
      },
      {
        "Port": 9,
        "Batt_V": 25.9,
      },
      {
        "Port": 10,
        "Batt_V": 25.9,
      }
    ]
  }
}
VERY basically, JSON works upwards from 0.
On my Mate3 I am using ports 1, 2, 3, 9, 10. But any JSON query you do will “see” them in order 0, 1, 2, 3, 4
For example,
msg.payload.devstatus.ports[0].Batt_V
will see the value “25.8“, as it’s looking at the “Batt_V” of the port 0nth (aka 1st) on the list.
msg.payload.devstatus.ports[1].Port
will return “2”
msg.payload.devstatus.ports[2].Batt_V
will return “26.0”
msg.payload.devstatus.ports[3].Port
will return “2”
msg.payload.devstatus.ports[4].Batt_V
will return “25.9”
msg.payload.devstatus.ports[3].Port
will return “10”
If you can’t intuitively work out how this code works from the node-red flow, my examples above, and playing around for an hour… then I give up.
Ok, fine, last example.
To create a new output value to be displayed in grafana;
1. Look at the Mate3’s JSON to find the value you want to display – for example, we’ll use Port 1, “VAC_out”: 234
2. Create a function node to grab that value from the JSON, call it “inv1VAC”
3. Edit the function to something like this:
var inv1VAC= 0;

inv1VAC= Number(msg.payload.devstatus.ports[0].VAC_out);
msg.payload =
{
    inv1VAC: inv1VAC,
}
return msg;
4. Edit the output influxdb out node to be called “inv1VAC”, make the measurement “inv1VAC” and hit “done”. The output node will grab the “inv1VAC” and send it to your database, easy peasy.


You must be logged in to post a comment.